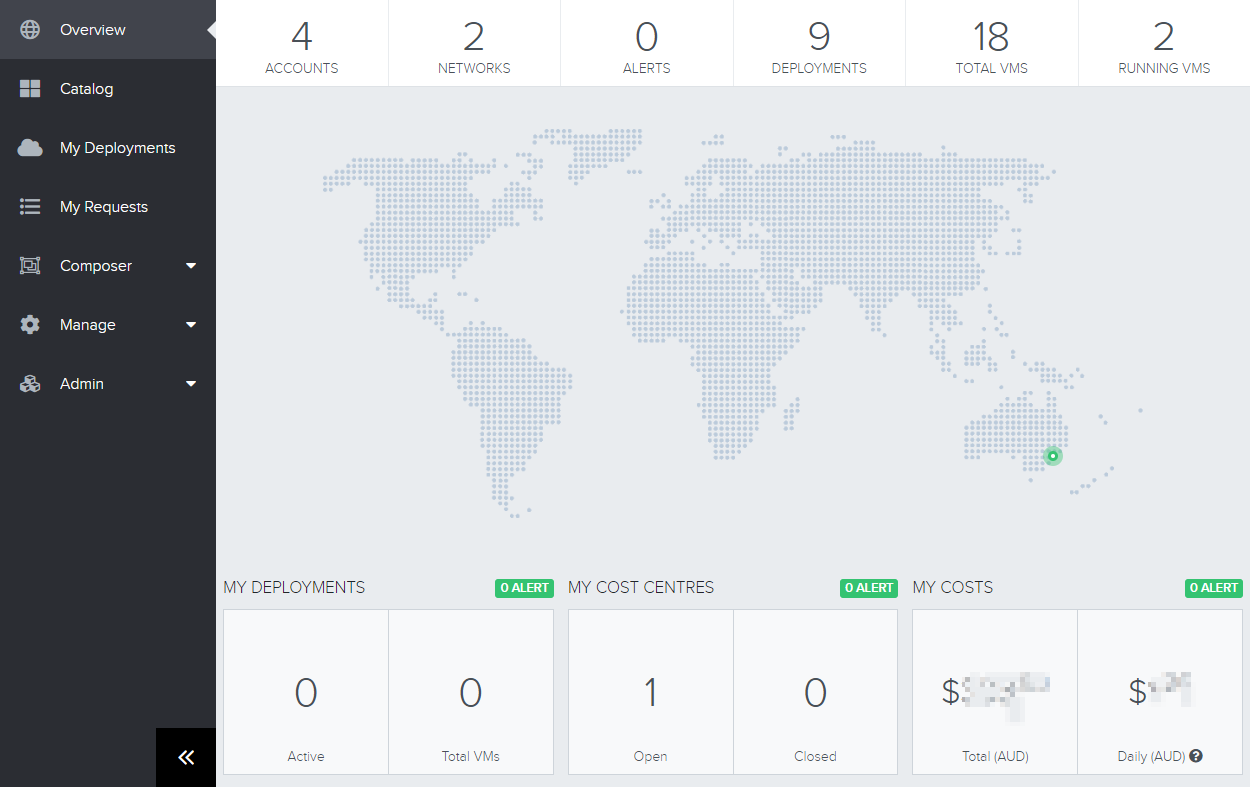
The Buttonwood Automation Overview screen provides a visual representation of the organisation's cloud configuration, deployments, resource locations, and costs.

Top Section
The top section provides an organisation's overview of Cloud resources, including the number of configured accounts, networks, any alerts, deployments, total number of virtual machines deployed, and the number of virtual machines that are powered on.

Clicking on each statistic will drill further into the relevant sections.
Middle Section
The middle section indicates all Service Provider locations which the organisation has deployed workloads to. Locations are indicated by markers, using the below colour scheme to indicate the condition of workloads in each region:
- Green: All deployments are operating without any fault
- Yellow: There are deployments currently in transition between states - eg. starting or stopping
- Grey: All deployments are currently inactive/offline
- Red: Deployments are active but there are some in a degraded state

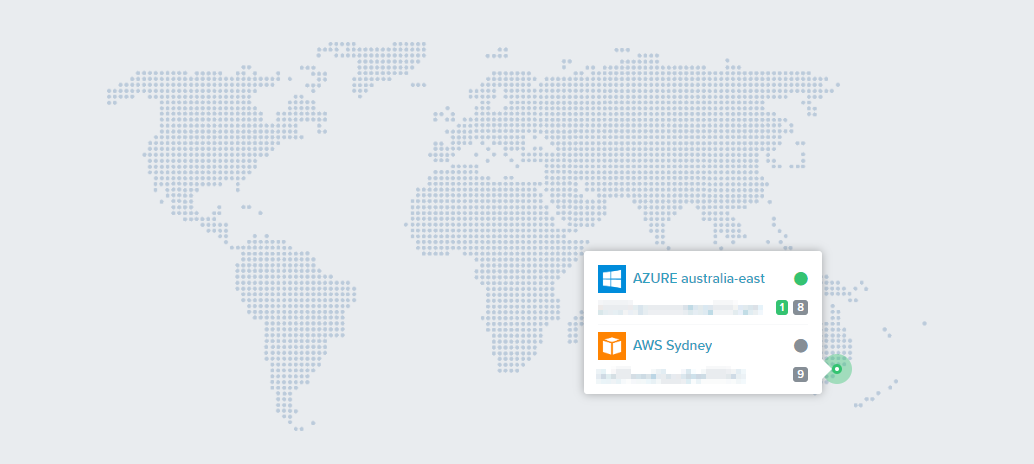
Hovering over a resource location marker provides further information into the number of running and standby instances in each Service Provider in that location. Clicking on the Service Provider further drills down into the list of instances for the selected Service Provider.
Bottom Section
The bottom section provides a user's overview of cloud resources for the logged in user, including a summary of Deployments, Cost Centres, and Costs.
